Key Developments
- Interest Rate Steady: The Bank of Canada decided to keep its policy interest rate unchanged at 5% in December (the last meeting of the year). Their next upcoming meeting is on January 24, 2024.
- Inflation Watch: November’s inflation numbers are due on December 19th. October saw CPI Inflation decrease to 3.1% from 3.8% in September. It’s an essential metric, as it can influence future decisions on interest rates.
- Mortgage Rates Check: For those in the house-hunting phase or considering a refinance, the best 5-year fixed mortgage rate from the Big 6 Banks is currently sitting at 5.53% (source: ratehub.ca) which is a slight decrease from last month. If you’re in need of a mortgage professional, get in touch and I’m happy to recommend someone I know, like, and trust.
With the holidays fast approaching, the Toronto real estate market is headed into its seasonal hibernation until the spring market starts in Jan/Feb. While it is typical for activity to grind to a halt this time of year, this has still been one of the quietest November/December stretches I can remember.
The November TRREB numbers came out last week, and showed the absorption rate creeping back up off of the all-time lows we saw in October and September. As a recap, the absorption rate is the ratio of sales to new listings in a given month.
November saw a 40.2% absorption rate, which indicates we are still in a buyer’s market. It’s well above the low we saw in September (28.6%) though it is still the lowest absorption rate in any November since 2008.
Another market indicator I like to look at is the sold-to-active listing ratio. If you’re one of my active buyers right now, you’ve probably heard me talk about this at length. The sold-to-active listing ratio is a measure of how fast inventory is moving. The active listings number is the total number of properties available on MLS on the last day of the month and is compared with how many listings we sold in that month.
At the end of November, there were 7,266 active listings with merely 1,680 transactions in the entire month. This equals a 23% sold-to-active listing ratio (very sluggish).
Just for context, at the height of the market in February/March of 2022, the sold-to-active listing ratio was 116%. Think about that number for a second, it’s pretty crazy! Simply put, everything was selling as soon as it hit the market.
This fall, the sold-to-active listing ratio has been at 23% in September, October and November. If we ignore the peak and rewind to November 2019, before COVID, before near-zero interest rates, before the rate hikes, the sold-to-active listing ratio was 71%. If we consider 71% a normal Toronto market, 23% speaks more to what I’ve felt on the ground this fall—sluggish.
What’s Been Happening on Offer Nights
I tracked fewer offer nights in November (168), but enough to see that the trends I found in September/October continued. In total this fall I’ve tracked 1059 offer nights, and here is a recap of the results.
| Total | November | October | September | |
|---|---|---|---|---|
| All Property Types | ||||
| –Offer Nights Tracked | 1059 | 168 | 491 | 400 |
| –Did Not Sell | 70.1% (742) | 73% (122) | 74% (361) | 65% (258) |
| –Zero Offers | 60% (631) | 54% (90) | 60% (293) | 50% (199) |
| Condo | ||||
| –Offer Nights Tracked | 405 | 76 | 209 | 120 |
| –Did Not Sell | 85% (343) | 87% (66) | 88% (183) | 78% (93) |
| –Zero Offers | 71% (286) | 68% (52) | 73% (152) | 66% (72) |
| Detached | ||||
| –Offer Nights Tracked | 304 | 37 | 129 | 138 |
| –Did Not Sell | 66% (200) | 65% (24) | 66% (85) | 66% (91) |
| –Zero Offers | 55% (168) | 43% (16) | 53% (68) | 50% (69) |
| Semi/Townhouse | ||||
| –Offer Nights Tracked | 350 | 55 | 153 | 142 |
| –Did Not Sell | 57% (199) | 58% (32) | 61% (93) | 52%(74) |
| –Zero Offers | 51% (177) | 40% (22) | 48% (73) | 41% (58) |
The Condo sector has seen the softest market conditions by far this fall. On average 85% of Condo listings I tracked did not sell on offer night, and over 70% did not receive a single offer.
Holding offer nights continues to be a strategy I would advise against outside of specific circumstances where the combination of property type, location and price point are still in high demand.
If you want to discuss my findings in more detail feel free to reach out! Now let’s dive into the November TRREB Stats.
November TRREB Stats
Average Sale Price (Month-over-month)
Compared to October 2023, average sale price fell 3.9% across TRREB, and 6.8% in Toronto (see table below).
Average Sale Prices Month-over-month (All Property Types, November 2023 vs October 2023)

It is typical for average sale price to drop this time of year as the market slows down, and buyers tend to be in less competition. That being said, these drops are more significant than is typical from October to November.
I believe the types of properties selling in November 2023 vs October 2023 are having an impact on this reported number. There were about 300 fewer Freehold sales (detached, semi-detached, townhouse) in November vs October, and only 40 fewer Condo sales. So Condos are making up a much larger proportion, of sales in November than in October which have much lower average price points.
With this November being one of the lowest November’s for sales on record, this proportional difference can have an outsized effect on the average sale price.
Average Sale Price (Year-over-year)
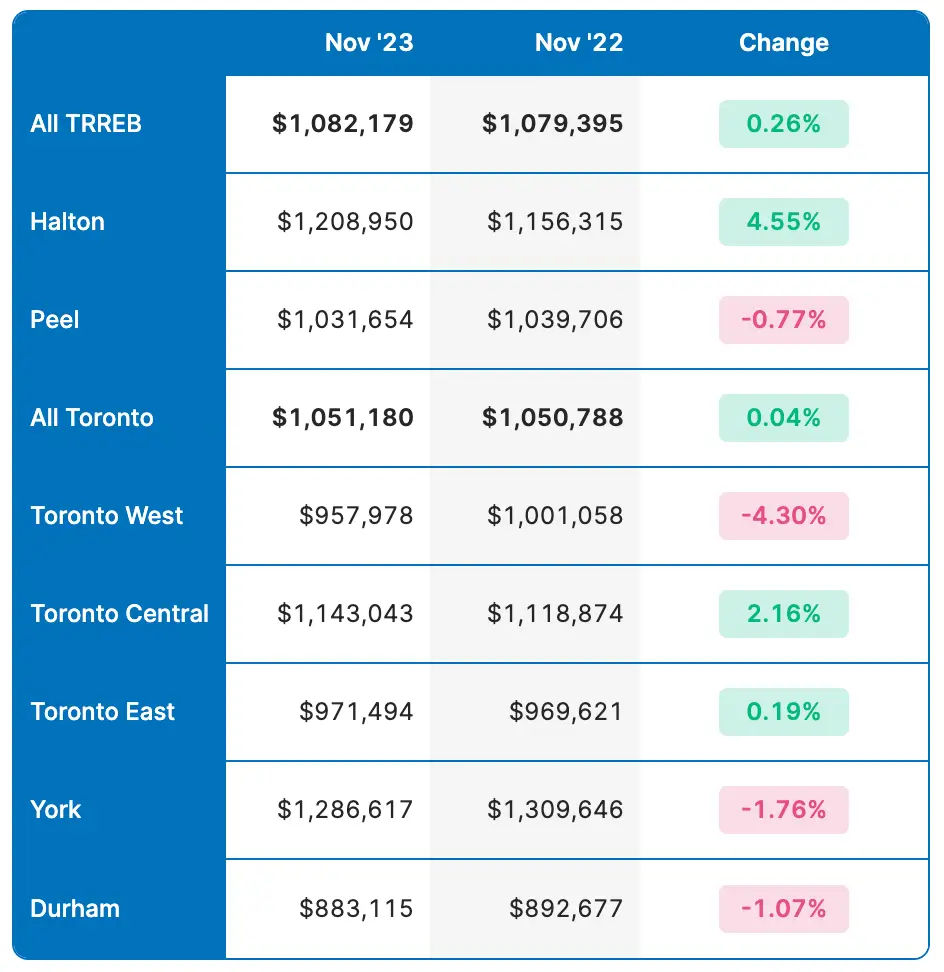
We end November almost exactly where we were in November 2022 (see table below).
Average Sale Price Year-over-year (All Property Types, November 2023 vs 2022)

It has been a roller coaster of a year for sale prices. With average sale price peaking at $1,196,101 in the spring market (May), before falling back to $1,082,496 in August climbing again to a peak of $1,125,928 in the fall market (October), before coming back to August levels this November.
The market has shown resiliency despite 10 interest rate increases since the spring market in 2022 and tough inflationary conditions. To date, average sales prices are down about 20% from all-time highs in February/March 2022, but the average sale price is still 20-30% above where we were before anyone had heard of COVID at the end of 2019/start of 2020.
New Listings (Month-over-month)
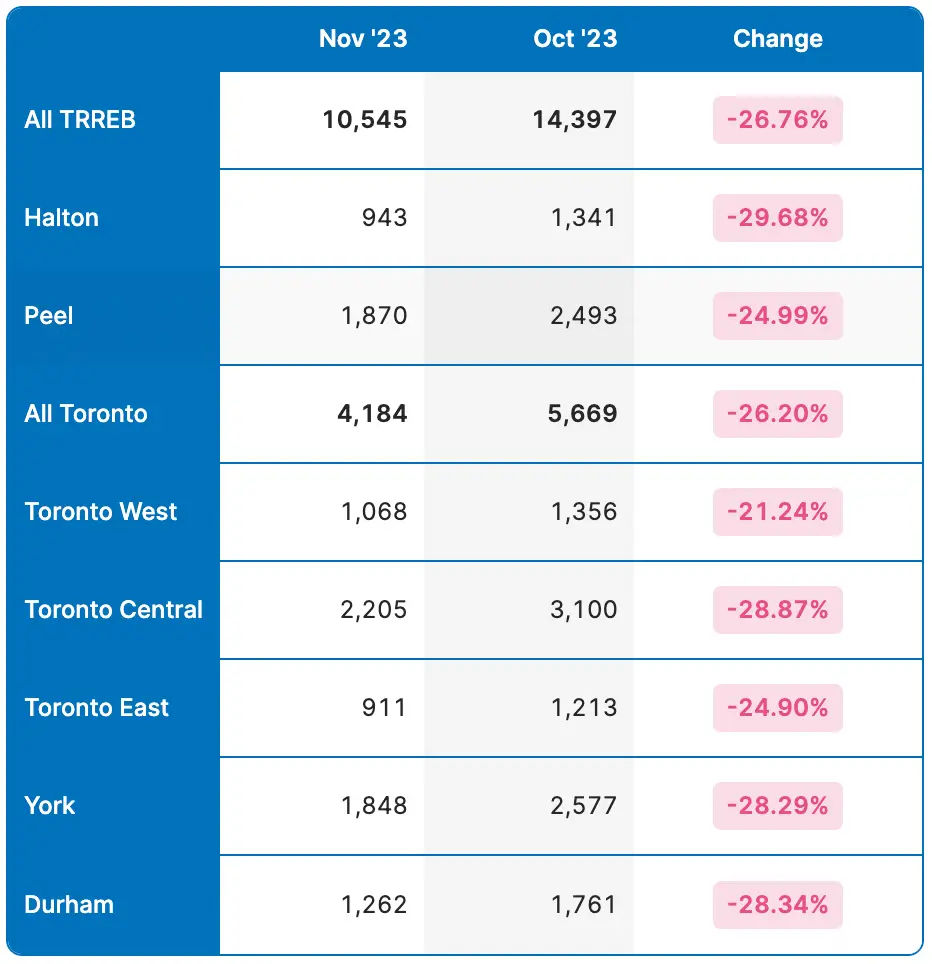
From October to November, new listings fell ~26% across all of TRREB as well as Toronto. This is much higher than the ~14% decline we’ve seen the last two years, but there was also a lot more people who decided to list in September/October this year. This fall market started early and ended early.
New Listings Month-over-month (All Property Types, November 2023 vs October 2023)

Sales (Month-over-month)
From October to November, sales fell ~9% across TRREB and ~12.5% in Toronto. These are actually in the normal range, but sales this fall were anything but normal.
Sales Month-over-month (All Property Types, November 2023 vs October 2023)

To recap, sales in August, September, and October 2023 were the lowest in their respective months in the last 20 years. November 2023 was the 2nd lowest November (the lowest being in 2008). Demand has been at all-time lows this fall, but supply has stayed low as well.
There has definitely been more inventory this fall than previous months in 2023, but is still well below where it was before interest rates began to rise.
Final Thoughts
This will be my last update for 2023, and December’s data won’t tell us much about what to expect in the spring market. It’s going to be all about the market activity in the second half of January and early February. We’ve had strong spring markets for the last 5 years (outside of 2020 at the start of the pandemic) where the average sale price has surpassed the peak of the previous fall, but that doesn’t mean it’s a guarantee.
After 3 straight rate holds by the Bank of Canada, and easing inflationary pressures, there have been some whispers about rate cuts in 2024. If this happens to coincide with any part of the spring market, we could see a flurry of activity.
If you’re looking to get an indication of where the market may be headed in the spring, I’d recommend getting in touch a few weeks into the new year after I’ve had a chance to monitor some of the activity.
Happy new year, and see you in 2024!
As always if you have more specific questions, need advice, or want to talk about what I’m seeing out there, get in touch. I’m always happy to talk shop!

