
I can’t believe it’s already July! It feels like it’s come faster than ever this year, but I probably say that to myself every summer…
Maybe it’s because the spring market picked up a little late this year and extended farther into May/June than is typical. Who knows? I just know I’m a sun worshipper–so it always goes too fast.
Ok, let’s talk real estate.
There was a good amount of inventory in June, but much like in June 2022, quality properties and particular types of product have been few and far between in June and July.
If you were/are looking for cookie-cutter Condos in the downtown core, there are plenty of options. But Condos with larger square footage, functional layouts, and in well-managed buildings, or higher priced homes in the $1.8mil – $5mil range have been sparse since the end of May.
I never read too much into the TRREB sales stats in the summer, because it’s fairly predictable. All stats tend to flatline in June, decline in July and August, then bounce right back in September. Prices, sales, new listings, you name it. I don’t see any reason/signs that this summer will be any different.
That being said there were some interesting numbers in June that I’d like to touch on.
Key Developments
- Inventory was strong in June, but quality was low
- Bank of Canada (BoC) policy interest rate is up 25 basis points from 4.75% to 5.00%
- The next Bank of Canada interest rate meeting is on September 6th, 2023
- CPI inflation fell from 4.4% in April to 3.4% in May. June’s numbers won’t be out until July 18th, 2023, and we’ll have 2 full months of data before the next interest rate meeting
- US inflation came in lower than expected in June, which may be a signal of what to expect here at home
June TRREB Stats
Average Sale Prices
Sale prices stayed fairly steady month-over-month from May to June with a slight decline of 1.17% across All of TRREB. What was surprising was a few of the regions surrounding Toronto like York, Durham, and Halton actually rose from May to June which isn’t typical.
TRREB Average Sale Prices Month-over-month (All Property Types, June 2023 vs May 2023)
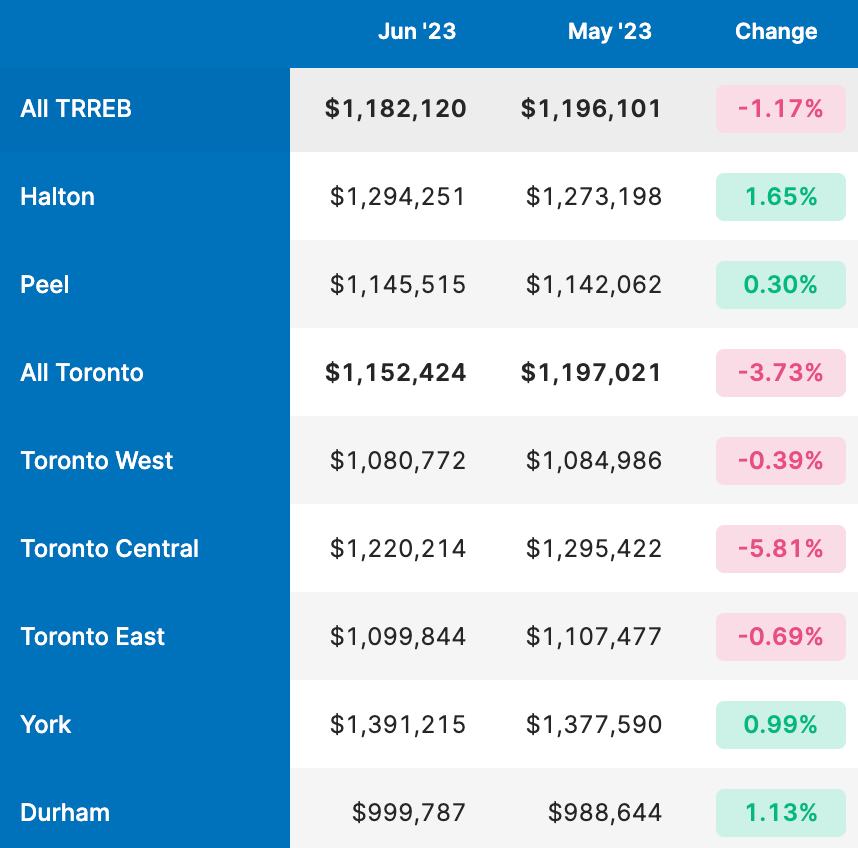
Toronto saw the largest decline at 3.7% month-over-month, which may sound like a big drop, but it is actually in the normal range for this time of year. Toronto tends to see the biggest decline, mainly driven by the exodus of activity in Central Toronto (fewer higher-priced homes on the market drag down average sale price stats).
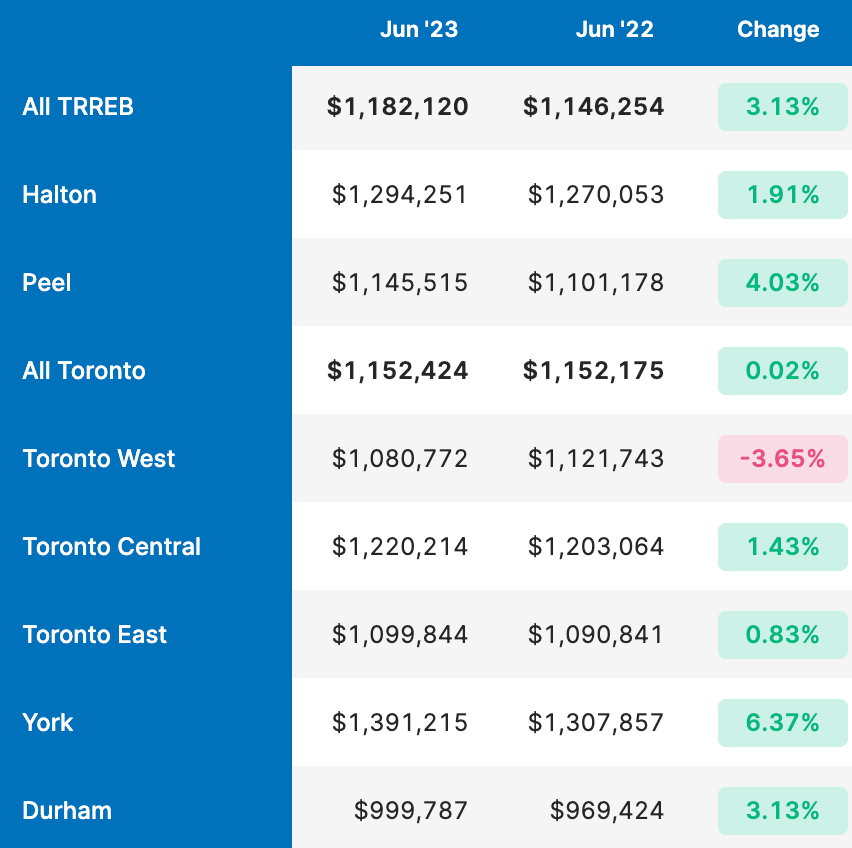
Year-over-year, there was a 3.13% increase in prices across TRREB mainly driven by Peel and Durham, with Toronto staying almost flat year-over-year (see table below). I found this pretty impressive considering interest rates were 300 basis points lower last June.
TRREB Average Sale Prices Year-over-year (All Property Types, June 2023 vs June 2022)
Sales
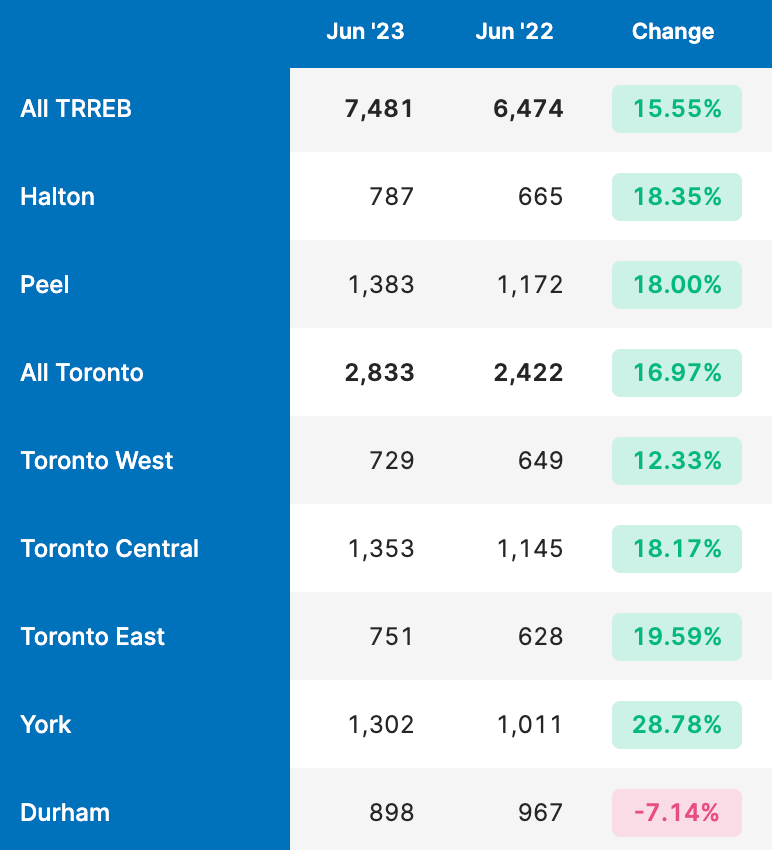
If we look at year-over-year sales (see table below) we can see that there was a substantial increase in sales of 15.5% across TRREB and ~17% in Toronto. That would make it seem like buyers are way more active, but remember that last summer we were in the midst of a market correction and uncertainty at the start of the Bank of Canada’s rate hiking cycle.
Buyer demand was much lower than it is right now, so I wasn’t surprised to see more sales than last year.
TRREB Total Sales Year-over-year (All Property Types, June 2023 vs June 2022)
Looking at month-over-month sales (see table below), we can see that sales decreased significantly at -17% across TRREB from May to June. While it’s typical for sales to drop this time of year, this is the largest drop in sales from May to June since 2017.
TRREB Total Sales Month-over-month (All Property Types, June 2023 vs May 2023)
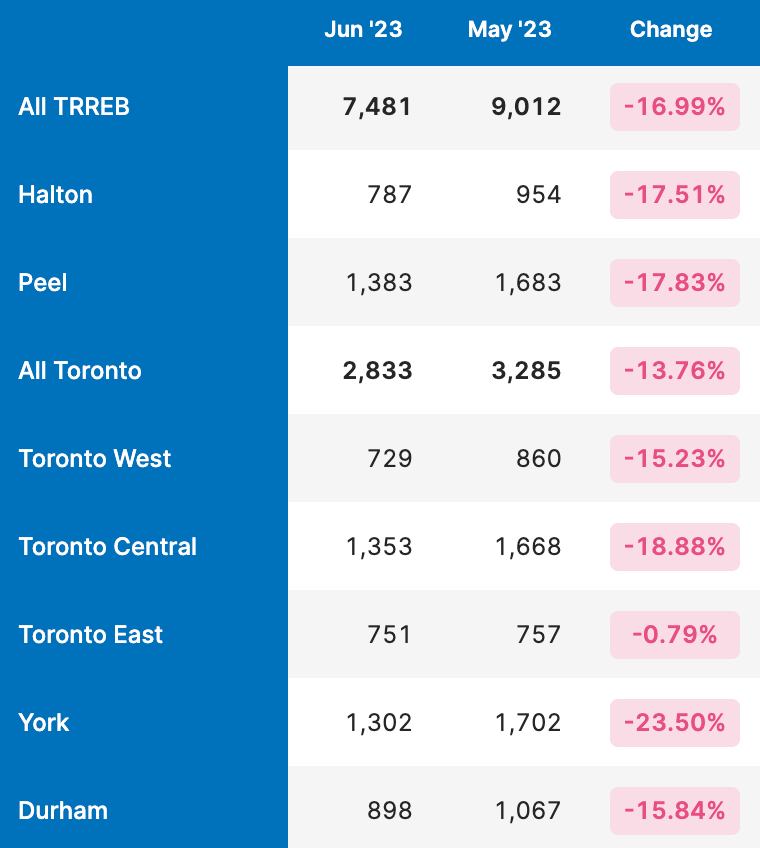
I don’t think this drop in sales is from a lack of buyer demand. I have ample active and motivated buyers I’m working with right now, as do close colleagues of mine. I think there is a lack of demand for the type of properties that are currently on the market.
My buyer pool is a small sample size compared to the entire Toronto market, so I could be way off here. But from my experience depending on what type of product you’re looking for, there is very little available to buy.
That’s what I think is showing in these sales numbers from June.
New Listings
It felt to me like a lot more listings hit MLS than is normal for June, however, the year-over-year stats tell a different story. New listings were fairly stable falling only ~3% across TRREB and in Toronto (see table below), which is only a few hundred sales difference from last year.
TRREB New Listings Year-over-year (All Property Types, June 2023 vs June 2022)

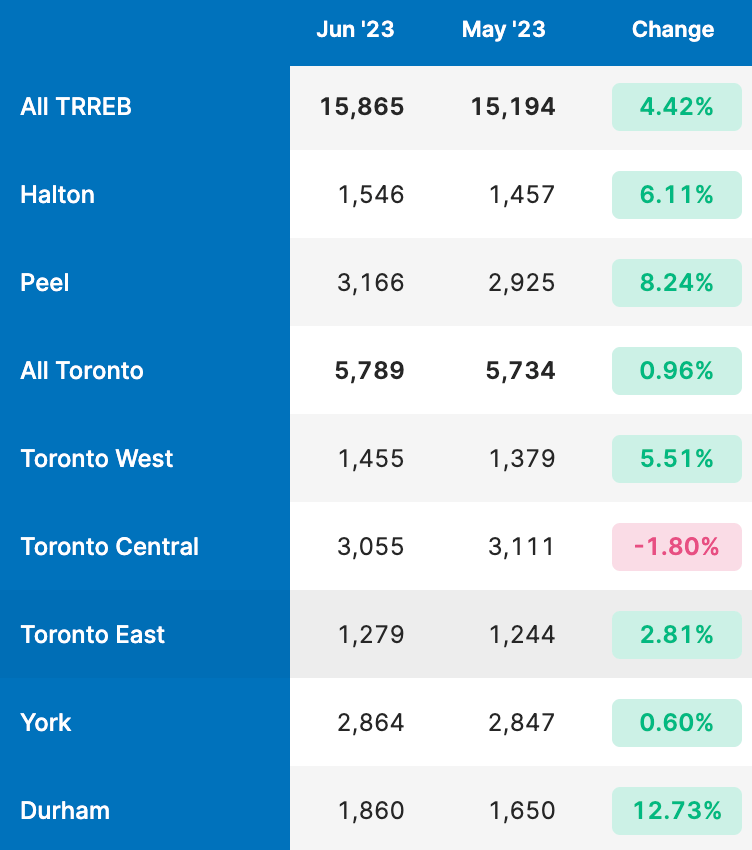
Looking at the month-over-month stats (see table below), I was surprised to see that New Listings actually increased by 4.4%. I can’t remember ever seeing New Listings increase from May to June, and looking at the data, I understand why!
Excluding the pandemic year of 2020, an increase in New Listings from May to June has not happened in over 20 years!
In fact, it’s typical to see a 10-20% drop in New Listings from May to June.
TRREB New Listings Month-over-month (All Property Types, June 2023 vs May 2023)
Does this increase have any significance? None that I could think of while writing this post. But it must considering it hasn’t happened in over 20 years. I’ll have to wait for more data in July, August and September to understand.
I suspect a lot of these properties that were listed in June that aren’t moving or getting showing activity will be terminated and re-listed in the fall.
Final Thoughts
Based on TRREB’s June stats, we had decreased sales (demand) and increased new listings (supply) which would point towards a balanced, or buyers’ market.
I’m not convinced we’re entering a buyer’s market, based on the types and quality of properties being listed, and that a more balanced fall market is the most likely outcome. My gut/experience tells me there will still be strong demand and competition for high-quality properties in the fall.
That’s all for this month, so enjoy the sunshine and I’ll see you in August!
As always if you have more specific questions, need advice, or want to talk about what I’m seeing out there, get in touch. I’m always happy to talk shop!