Key Developments
- Interest Rate Steady: The Bank of Canada decided to keep its policy interest rate unchanged at 5% in March. Their next upcoming meeting is on April 10th, 2024.
- Inflation Watch: February’s inflation numbers are due on March 19th. Inflation decreased to 2.9% in January from 3.4% in December. This put inflation inside the Bank of Canada’s target range (1-3%) for the first time since June 2023.
- Mortgage Rates Check: For those in the house-hunting phase or considering a refinance, the best 5-year fixed mortgage rate from the Big 6 Banks is currently sitting at 5.09% (source: ratehub.ca) which continues the downward trend on fixed rates. If you’re in need of a mortgage professional, get in touch and I’m happy to recommend someone I know, like, and trust.
Is it spring? Is it winter? I really want to lock my winter gear away, but its 15 degrees one day and snowing the next. But hey…at least the clocks switched back and the days are getting longer!
And just like we’re getting a little more sunlight every day until late June, I expect home prices to keep increasing throughout the spring too (nailed that segue).
Aimee’s Take
Last month I mentioned that the January TRREB data showed a decrease in average sale price from December 2023. It was the largest average sale price decrease by percentage from December to January since 2002. It also gave us a new market “bottom” since prices peaked in 2022.
The previous bottom was January 2023 at $1,038,668. January 2024 was $1,026,703.
I explained my perspective on these numbers in last month’s post, so give it a read if you’re interested. Coles notes–a larger proportion of Condo vs Detached and Semi-Detached homes were selling in January vs December, which I believe is what was showing up in the stats.
I finished off that article explaining that we have never had a price decline from January to February, so I expected a decent jump in prices.
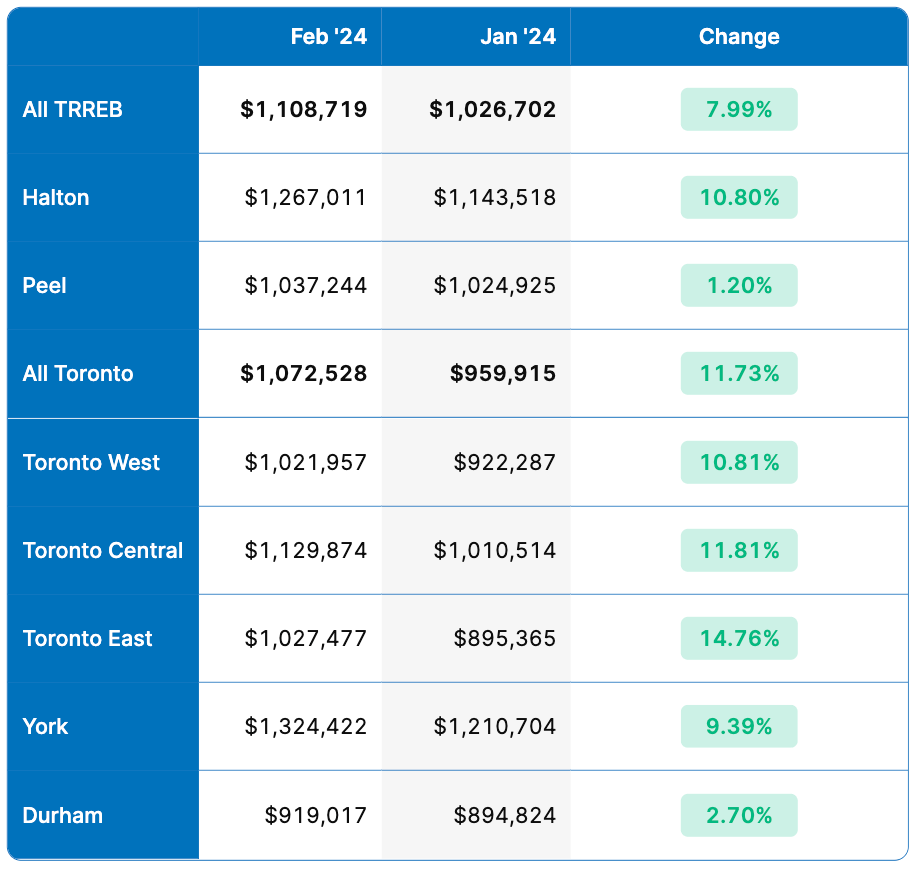
Well, the data showed an 8% increase across all TRREB regions (from $1,026,702 to $1,108,719) and an 11.7% increase in Toronto (from $959,915 to $1,072,528).
The interesting thing is that the sold-to-new listing ratio and sold-to-active listing ratio, which measure demand, didn’t really change much from January.
That aligns with my first-hand experience on the ground. I felt strong buyer sentiment in both January and February. Both on the listing side, and competing on properties on offer nights.
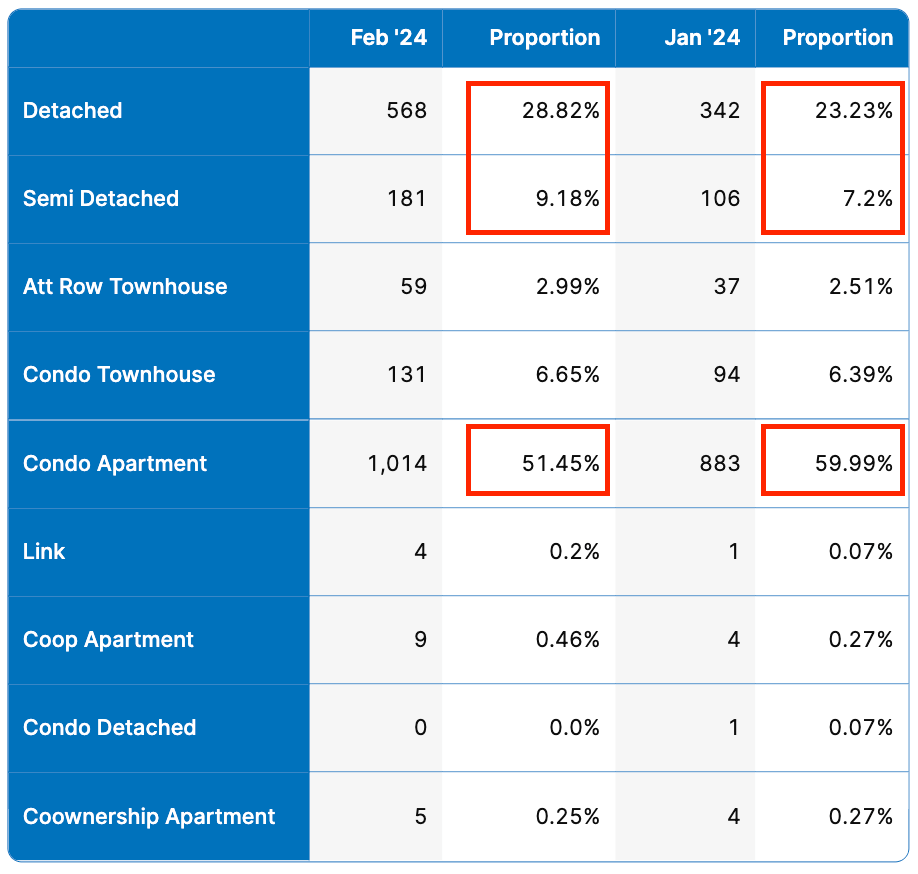
So I took a look at the same data as last month in terms of the proportions of the types of properties selling in February vs January 2024.
You can see in the table below that in January, detached & semi-detached homes made up about 30% of sales, and condos made up 60%. Contrasted with February where semi-detached & detached sales made up 38%, and condos made up 51%.

I think this big swing in the proportion of detached & semi-detached homes sold in February vs January accounts for some portion of this increase in average sale price. Those property types sell for higher premiums so they weigh the average higher.
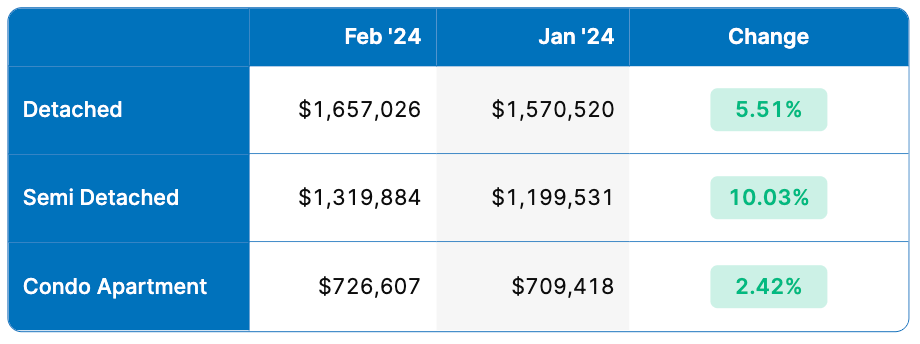
That being said, the two tables below show the price changes from January to February broken down by property type. The 1st table shows Toronto, and the 2nd shows all TRREB regions combined.


So when we compare apples-to-apples we see that there were some decent price increases from January to February, but semi-detached and detached homes saw most of the gains. I think this shows that this was real appreciation in the market.
I expect this momentum to keep going as the spring market moves forward. The Bank of Canada said much the same, Tiff Macklem saying last week his projections show the market is already picking up speed.
Alright, with all that said, here are the rest of the TRREB stats in case you’re interested.
February 2024 TRREB Stats
Average Sale Price
Compared to January 2024, average sale prices increased 8% across TRREB, and 11.7% in Toronto (see table below).
Average Sale Prices Month-over-month (All Property Types, February 2024 vs January 2024)

February sales prices stayed fairly flat year-over-year. With a modest 1.2% increase across all TRREB regions, and 0.1% in Toronto (see table below).
Average Sale Prices Year-over-year (All Property Types, February 2024 vs 2023)

New Listings
New listings increased month-over-month by ~37% across all of TRREB and ~26% in Toronto vs January (see table below).
New Listings Month-over-month (All Property Types, February 2024 vs January 2024)

We also saw a year-over-year increase of ~36% across all of TRREB and ~31% in Toronto (see table below).
New Listings Year-over-year (All Property Types, February 2024 vs 2023)

While it may seem like an increase in supply would ease prices, sales kept pace (as I mentioned earlier, the sales-to-new listing ratio was basically unchanged from last month). These new listings are getting scooped up.
Sales
Month-over-month sales increased 33% across TRREB and ~34% in Toronto vs January (see table below).
Sales Month-over-month (All Property Types, February 2024 vs January 2023)

Year-over-year sales increased 17% across TRREB and ~13% in Toronto from February 2023 (see table below).
Sales Year-over-year (All Property Types, February 2024 vs 2023)

Final Thoughts
The highest average sale price we hit in 2023 was $1,196,000 across all TRREB regions and $1,197,000 in Toronto. Both happened in May. My gut is telling me based on my boots-on-the-ground experiences so far this year we will see or exceed those numbers this spring.
A combination of rate cuts on the horizon and the shock of 5-6% interest rates wearing off and starting to feel “normal” is bringing many buyers off the sidelines.
As always if you have more specific questions, need advice, or want to talk about what I’m seeing out there, get in touch. I’m always happy to talk shop!

