Did August just fly-by for anyone else? We went from face-melting heat to patio-heater season in a week! Speaking of which, if you’re looking to make the most of your patio season, Home Depot’s has heaters on sale right now. I own two of these and they’re a total game-changer! 😀
Now, when it comes to real estate, September signals the start of the fall market. But in reality, things don’t really kick off until the week after Labour Day. Between back-to-school chaos and everyone settling into their work routines, the true market hustle kicks off this week (September 11th).
That being said, one thing that did catch my eye in the first week of September was the number of Condo listings. It’s way more than I remember from past years. And a good portion of Condos are tenant-occupied (35%). Comparing June-August 2023 to 2022, there was an approximate 50% increase in tenant-occupied Condos listed.
If I were to hazard a guess, landlords are starting to feel the financial pinch of high-interest rates coupled with rent control preventing them from passing on any cost to tenants. Particularly those on variable rate mortgages, or those who are refinancing from 2017-2018.
In terms of August TRREB Stats, I’ve always mentioned I don’t usually put too much stock in summer numbers. Everything – from sales to prices to new listings – tends to dip. It’s cyclical. Regardless, I’m here to break it all down and offer some insights below.
Key Developments
- Interest Rate Steady: The Bank of Canada decided to keep its policy interest rate unchanged at 5%. We’ll see what they decide next at their upcoming meeting on October 25th.
- Inflation Watch: I’ve got my eye on the inflation data, which is due on September 19th. In July, the CPI Inflation was at 3.3%. It’s an essential metric, as it can influence future decisions on interest rates.
- Mortgage Rates Check: For those in the house-hunting phase or considering a refinance, the average 5-year fixed mortgage rate from the Big 6 Banks is currently sitting at 5.69% (source: ratehub.ca). If you’re in need of a mortgage professional, get in touch and I’m happy to recommend someone I know, like, and trust.
August TRREB Stats
Month-over-month
The average sale price fell 3.2% month-over-month. That is a pretty significant decline historically, as we typically see a 1-2% decline. It’s a bit of a head-scratcher as to why it decreased so much.
Average Sale Prices Month-over-month (All Property Types, August 2023 vs July 2023)

Toronto faired the worst in the GTA with a 5.65% decline, driven by the East End.
Was it an increase in supply (new listings)? Nope, new listings were down 10.3%.
New Listings Month-over-month (All Property Types, August 2023 vs July 2023)

So then it must be a decrease in demand (sales)?
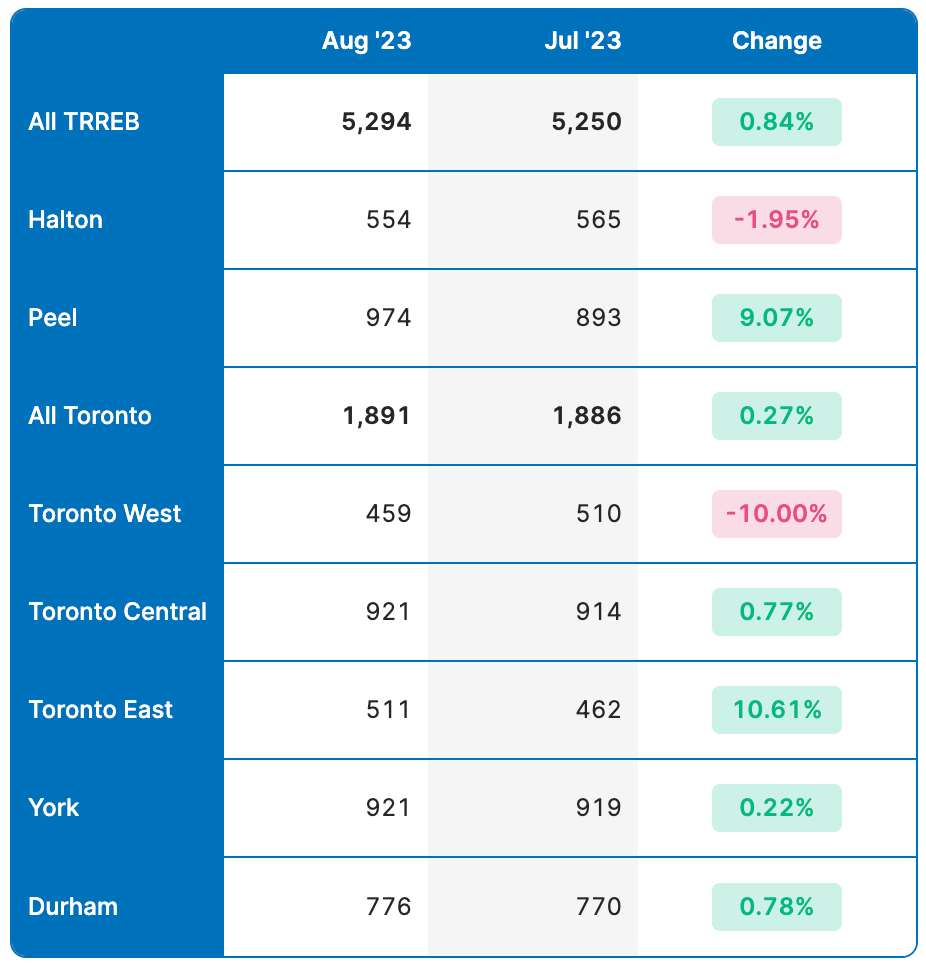
Well, that doesn’t seem to be the case either. If we look at month-over-month sales, you can see that sales actually slightly increased by 0.8% from July to August.
Sales Month-over-month (All Property Types, August 2023 vs July 2023)
Thinking logically, with less supply, and similar or slightly increased demand compared to July, you would think prices would stay either flat or potentially increase.
I’m not going to lie, this is a little perplexing. It’s definitely an outlier. What does it mean? Difficult to tell at this point. Most of the decrease seems to be in the Condo and Semi-detached market as Detached home prices stayed flat from July to August.
Let’s look at the year-over-year data to see if we can find any explanations.
Year-over-year
Average sale prices stayed fairly flat from last August.
Average Sale Price Year-over-year (All Property Types, August 2023 vs August 2022)

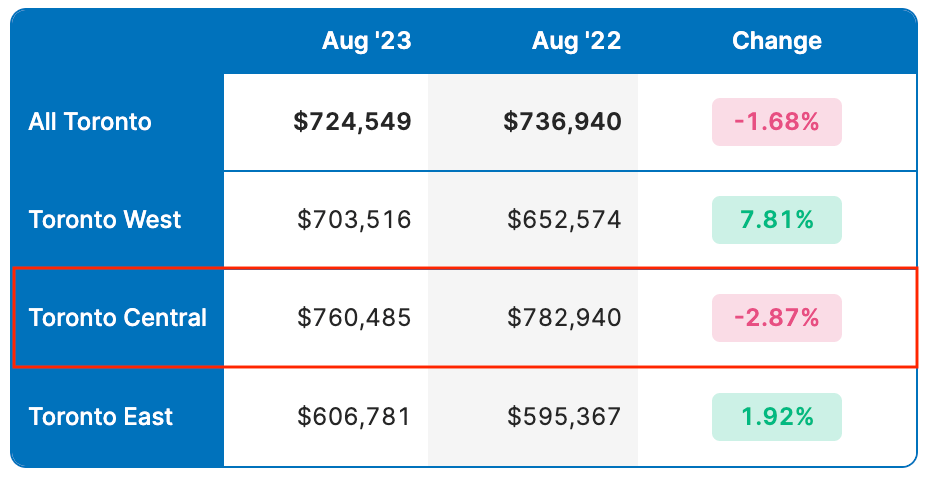
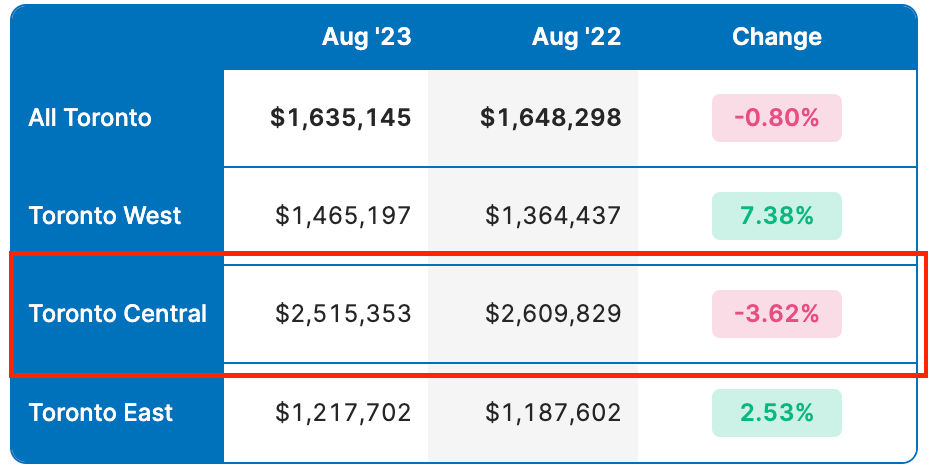
Toronto saw a 2.5% decline, year-over-year, which seems to be mostly driven by the Condo and Detached market in Central Toronto as you can see in the tables below.
Condo Average Sale Price (Year-over-year, August 2023 vs August 2022)
Detached Average Sale Price (Year-over-year, August 2023 vs August 2022)
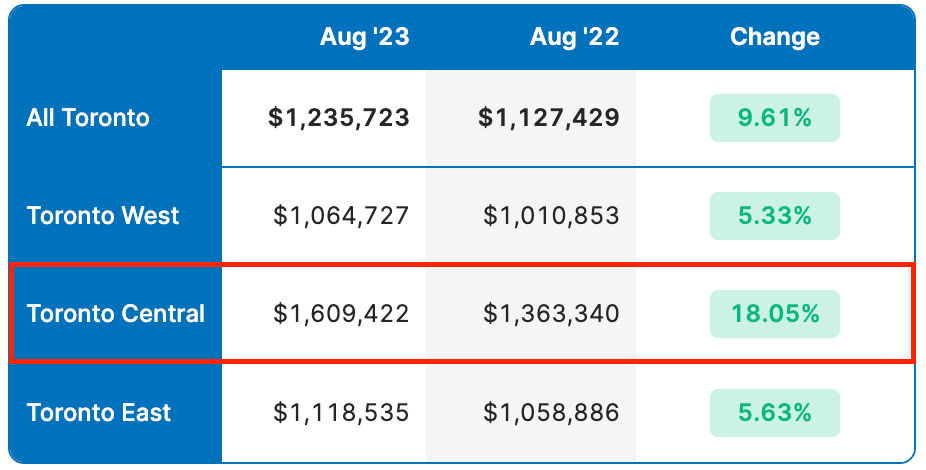
In comparison, Semi-detached homes in Central Toronto have done quite well, showing that there is still strong demand for single-family starter homes.
Semi-Detached Average Sale Price in Toronto (Year-over-year, August 2023 vs August 2022)
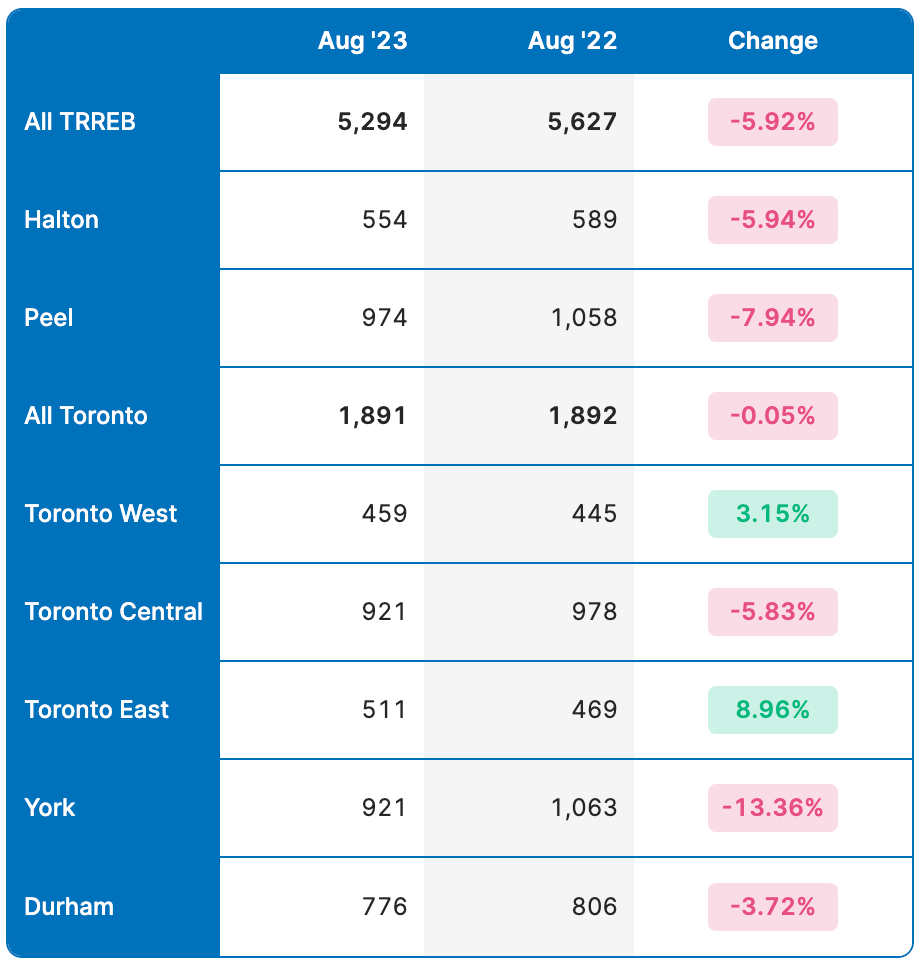
Looking at sales we can see that there was a decline of almost 6% which points to less demand than this time last year.
Sales Year-over-year (All Property Types, August 2023 vs August 2022)
Now if we look at New and Active Listings, we start to see something interesting. New Listings were up 16.7% and Active Listings (listings carrying over from previous months) were up 16.5% from last year.
New Listings Year-over-year (All Property Types, August 2023 vs August 2022)

Active Listings Year-over-year (All Property Types, August 2023 vs August 2022)

So we had a lot more inventory this August than last year, which could explain the larger-than-average decline this August.
Final Thoughts
The GTA real estate market is very nuanced, and one month of data, especially summer data, can be difficult to interpret.
This August could be an outlier, a sign of cooling demand, or a calm before the storm. I don’t try to make predictions about what will happen, I just watch the market closely and look for signs of the direction it’s headed in the current market cycle.
In my opinion the best tools to understand where the market is going in the short term is monitoring the type of listing strategies sellers are choosing, and the amount of competition on offer nights.
As I mentioned earlier in this post, this week (September 11th) is where the market really kicks off. I’ve got my eyes on a number of offer nights to see if I can get an early indicator of where the fall market might be heading.
As always if you have more specific questions, need advice, or want to talk about what I’m seeing out there, get in touch. I’m always happy to talk shop!

