
I had 2 predictions I laid out in last months update.
- Number of sales will be lower than usual for September
- New listings will be typical for this time of year, but supply will continue to outpace demand
Looking at prediction #1 we get the ✅, but I didn’t expect just how low the sales would be..
In September 2022 there were only 5,038 sales, which is the fewest in a September since this data became available in 2002! I expected lower sales than usual given the market conditions, but for context, this is 44% less sales than September 2021, and 14% less than the previous low, which was 5,846 sales back in September 2002!
Can you imagine how many less residential units there were in the GTA 20 years ago? That many sales was probably average back then…this is a very low volume for what is typically a busy time of year.
Prediction #2 I’m going to give myself the ❌. New listings were not typical for this time of year. We’ve averaged over 15,000 new listings in September the previous 6 years, and this September there were 11,237 new listings.
September wasn’t only slow from a data standpoint.
Between what I’m experiencing on the ground, and conversations I’ve had with my peers in the industry, everyone is feeling the slow down. Normally I’m running around like a chicken with its head cut off in September. But this year, I’ve actually been able to have some down time–which is rare, but welcome 😄.
Slow market, high inventory. What gives?
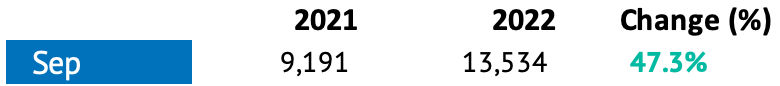
Even though there were fewer new listings than typical for this time of year (~20-30% less than average), there is still a lot of inventory that has built up over the last few months. In fact, There were 47.3% more active properties on the market this September compared to September 2021.
Ok, so if we have high inventory and a low number of sales, it’s easy to assume that buyer demand is low…but I can tell you from first hand experience, it’s just not the case.
I’m personally working with a number of buyers who are very motivated to buy, and I’ve had countless conversations with other agents who are in the same boat.
So what is it?
It’s a lack of quality inventory that is slowing the market down. Quality listings are beyond scarce at all price-points. A lot of the surplus inventory that was available in September were:
- Listings that were on the market since the summer
- “New listings” that are just re-lists from the summer.
These properties are continuing to linger on the market with little activity.
I only saw 3 notable sales in Toronto throughout all of September where the seller’s did very well. They had the benefit of being one of the few quality listings on the market with little competition.
Offer nights on quality properties
I’ve been following and tracking every offer night like a hawk over the last few weeks, and I’ve seen/felt a an uptick in activity over the last week of September and 1st week of October.
I’ve personally been in a number of offer nights with 5+ offers, and all of them fetched prices reminiscent of Fall 2021 (more on price later). I’ve seen a few offer nights in Toronto with 10+ offers (the highest being 15) and there has been some pretty insane offer nights recently in other areas of the GTA:
- One in Durham had 32
- One in Brampton had 49
The listing in Brampton was under the $1 million price-point, suggesting there are still a lot of motivated first-time buyers out there. They’re all just competing for the same handful of good listings.
Average Sale Price Movement
Ok, so how are these low sales + high inventory playing into price? Well it depends how you look at the data. I’m not going to make any predictions on price here. There are still more potential rate hikes, and inflation hasn’t gone anywhere. No one can predict what will happen. I can only tell you what I’m seeing out there.
Month-over-month
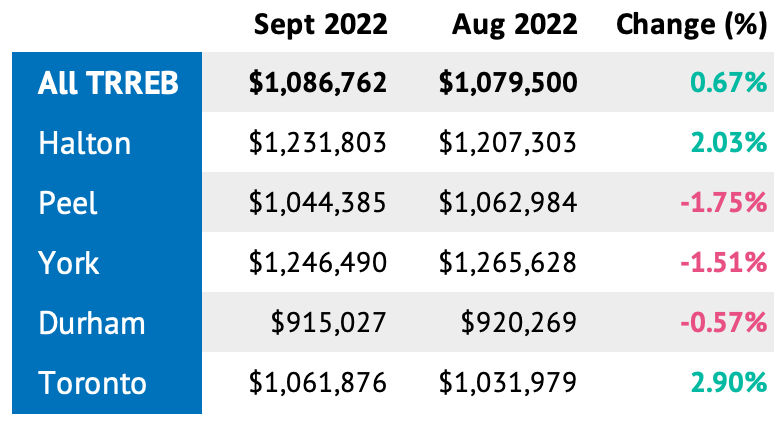
Since August 2022, there was a modest price gain of +0.7% across all of TRREB, with Halton and Toronto responsible for that major lifting at +2% and +2.9% respectively.
If we look year-to-date price change (see table below), it would appear that we are starting a bit of a reversal from the correction that started in February 2022. If we look at All TRREB regions combined (2nd column), we have two consecutive months of price increases since July 2022. However, this is not the case if you look at each region individually.
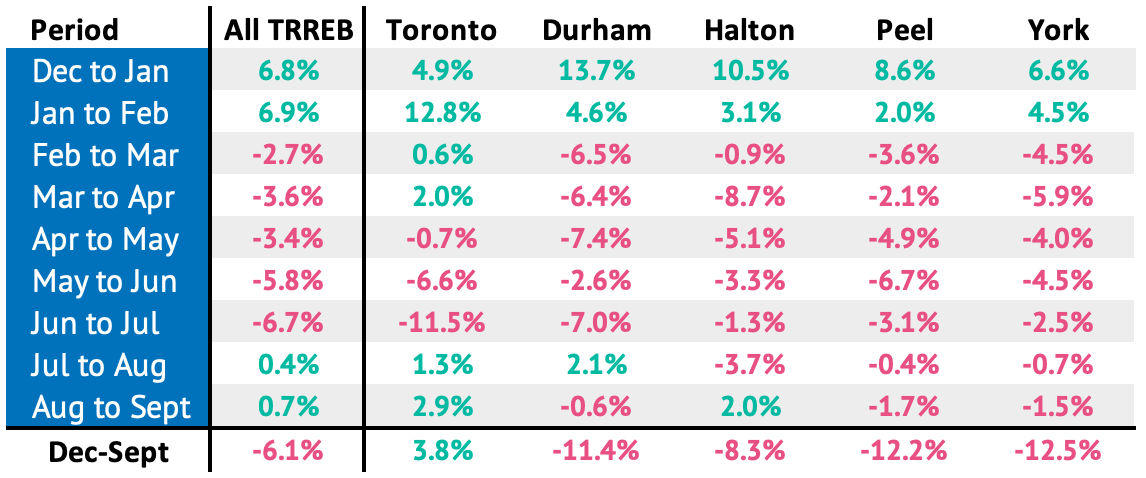
Toronto is the only Region that has seen 2 months of consecutive growth, and is bringing up the TRREB average.
Durham’s 2022 market low was in July, and while it lost some steam in September falling month-over-month from August, it still stayed above it’s July low suggesting possible stabilization.
Halton showed its first gain since February 2022, marking August as its most recent low point.
York and Peel regions appear to still be on the decline as September brought another new low.
Year-over-year
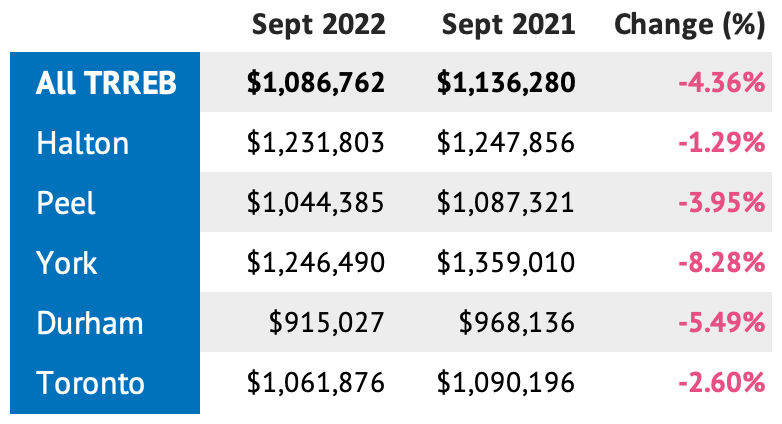
Looking at the year-over-year data paints a slightly different picture. While it appears from the month-to-month that there is a possibility of a trend reversal, we actually saw the first year-over-year decline in price since prices began falling in February.
The table below shows price change in a given month from 2021-2022.
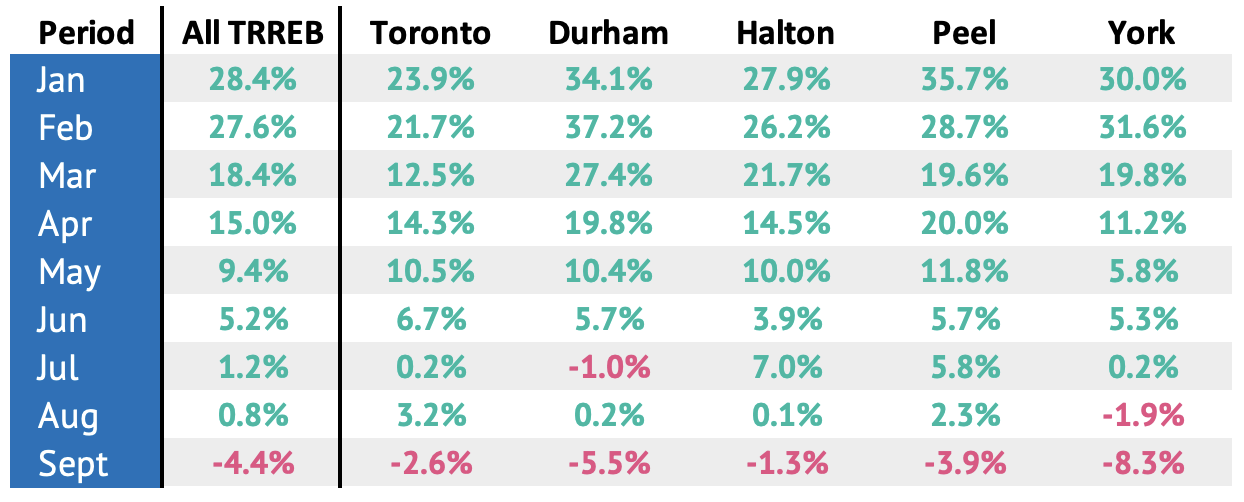
You can see in September 2022 (last row) that we are down 4.4% from September 2021.
September marks the first month since 2018 that we saw an annual year-over-year decline in sale price. I’m not actually surprised by this, as we had such explosive growth from Q4 2021 to Q1 2022 (homes had appreciated 28.4% from January 2021 to January 2022). It was going to take some time. But you can see each month that gains have been eroding.
What I’ll Be Looking for in October
It’s anyone’s guess where prices will go in October and November, but the interest rate announcement on October 26th will be a big factor.
Inflation dropped again in August to 7% which is the second straight report to show a decline since inflation peaked in June at 8.1% and was actually better than market expectations of 7.3%. I don’t doubt there will be another hike in October, but fingers crossed it is a smaller 25 basis point hike.
I outlined a few scenarios at the end of my August report for what I thought could happen to interest rates on October 26th if we received a positive inflation report like this (I’m no economist, just sharing some of my own thoughts).
As I mentioned earlier I’ve started to see some increased activity to start October, including more offer nights with multiple offers (which I will continue to track closely). It’s likely we will continue to see high inventory, and my hopes are that there will be more quality listings hitting the market this month.
(If you have questions, need advice, or want to talk about what I’m seeing out there, get in touch).